HTTP probe
The HTTP probe lets you send a fully configured HTTP request to any target and inspect the response. It supports all standard methods, custom headers, query parameters, cookies, and a request body.
Configuration
Section titled “Configuration”| Field | Description |
|---|---|
| URL | Full target URL including scheme (http:// or https://) |
| Method | HTTP method: GET, POST, PUT, PATCH, DELETE, HEAD, OPTIONS |
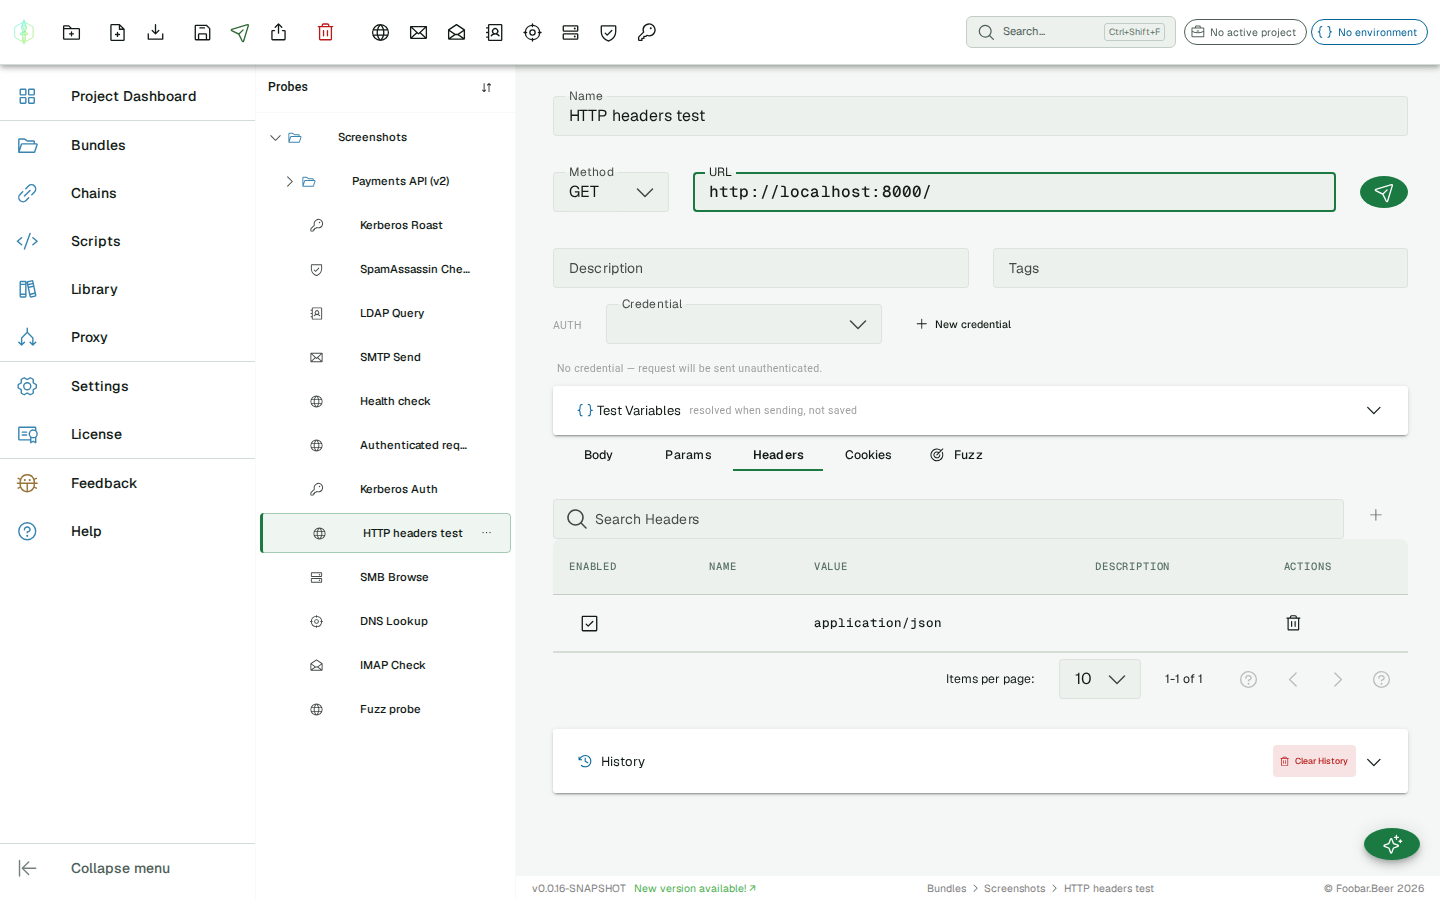
| Headers | Key-value pairs sent as request headers |
| Query parameters | Key-value pairs appended to the URL |
| Body | Request body (for POST/PUT/PATCH) |
| Cookies | Key-value pairs sent as Cookie header |
Request import & export
Section titled “Request import & export”Move requests in and out of VirtuProbe without retyping them.
Import from cURL / wget
Section titled “Import from cURL / wget”Paste a curl or wget command directly onto the URL field. VirtuProbe detects the command and fills in the method, URL, headers, query parameters, body, and cookies for you. A snackbar offers Undo if the paste wasn’t what you wanted.
This is the fastest way to bring in a request copied from browser DevTools (“Copy as cURL”), API documentation, or a teammate.
Export to standard tools
Section titled “Export to standard tools”With an HTTP probe selected, click the Export Request button in the toolbar. Choose a target and copy the generated command:
- cURL
- wget
- Python (
requests) - PowerShell (
Invoke-WebRequest)
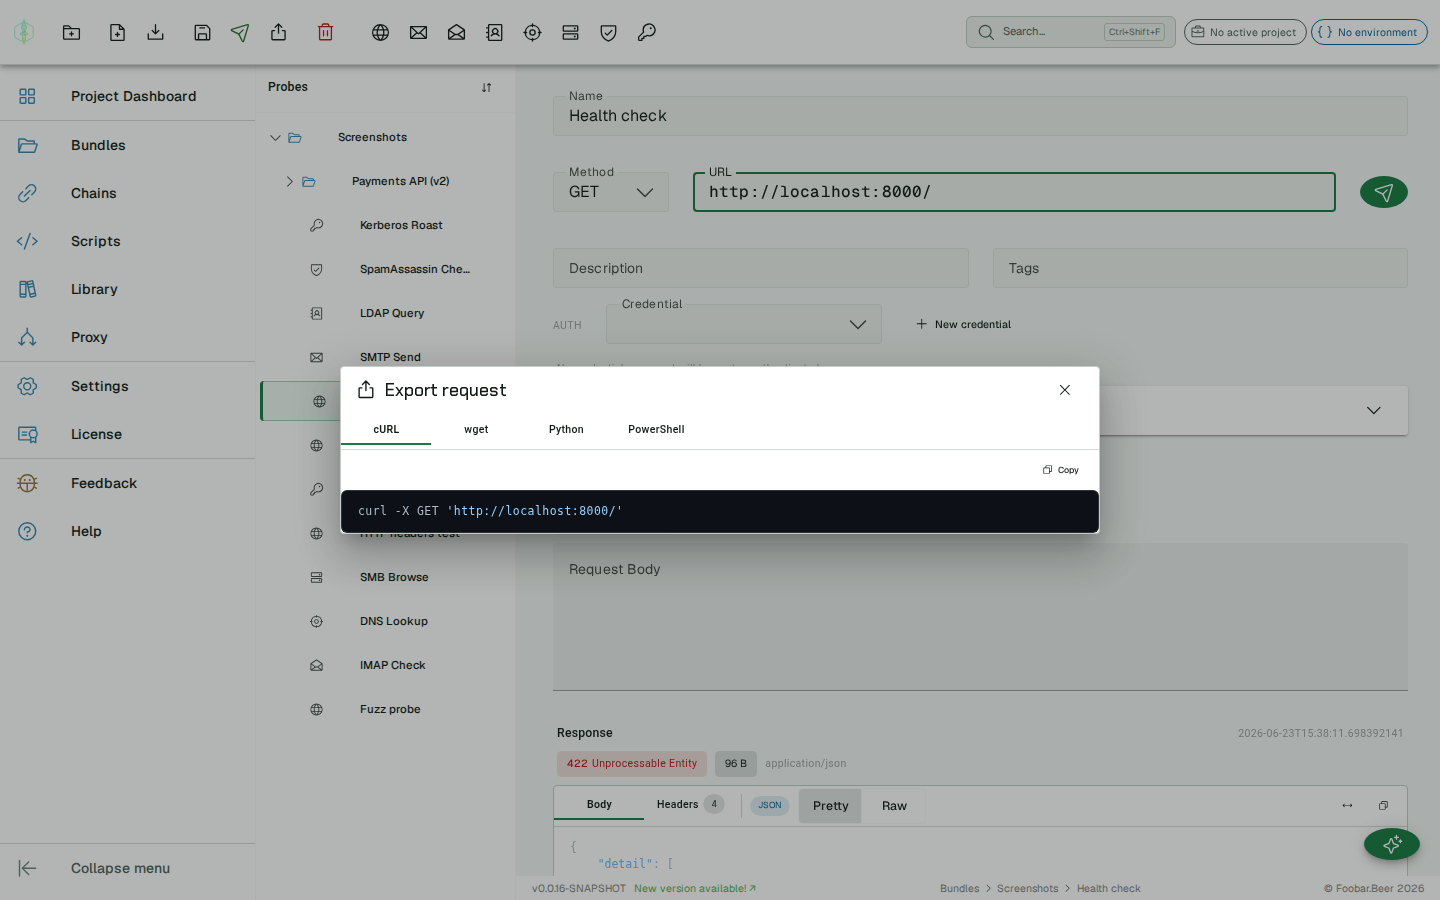
The export reflects the probe exactly as configured, including headers, body, and cookies, so you can reproduce the request outside VirtuProbe or paste it into a report.
Variable substitution
Section titled “Variable substitution”All fields support {{variable}} placeholders resolved from the active environment:
URL: https://{{host}}/api/usersHeader: Authorization: Bearer {{token}}Body: {"email": "{{email}}"}Response
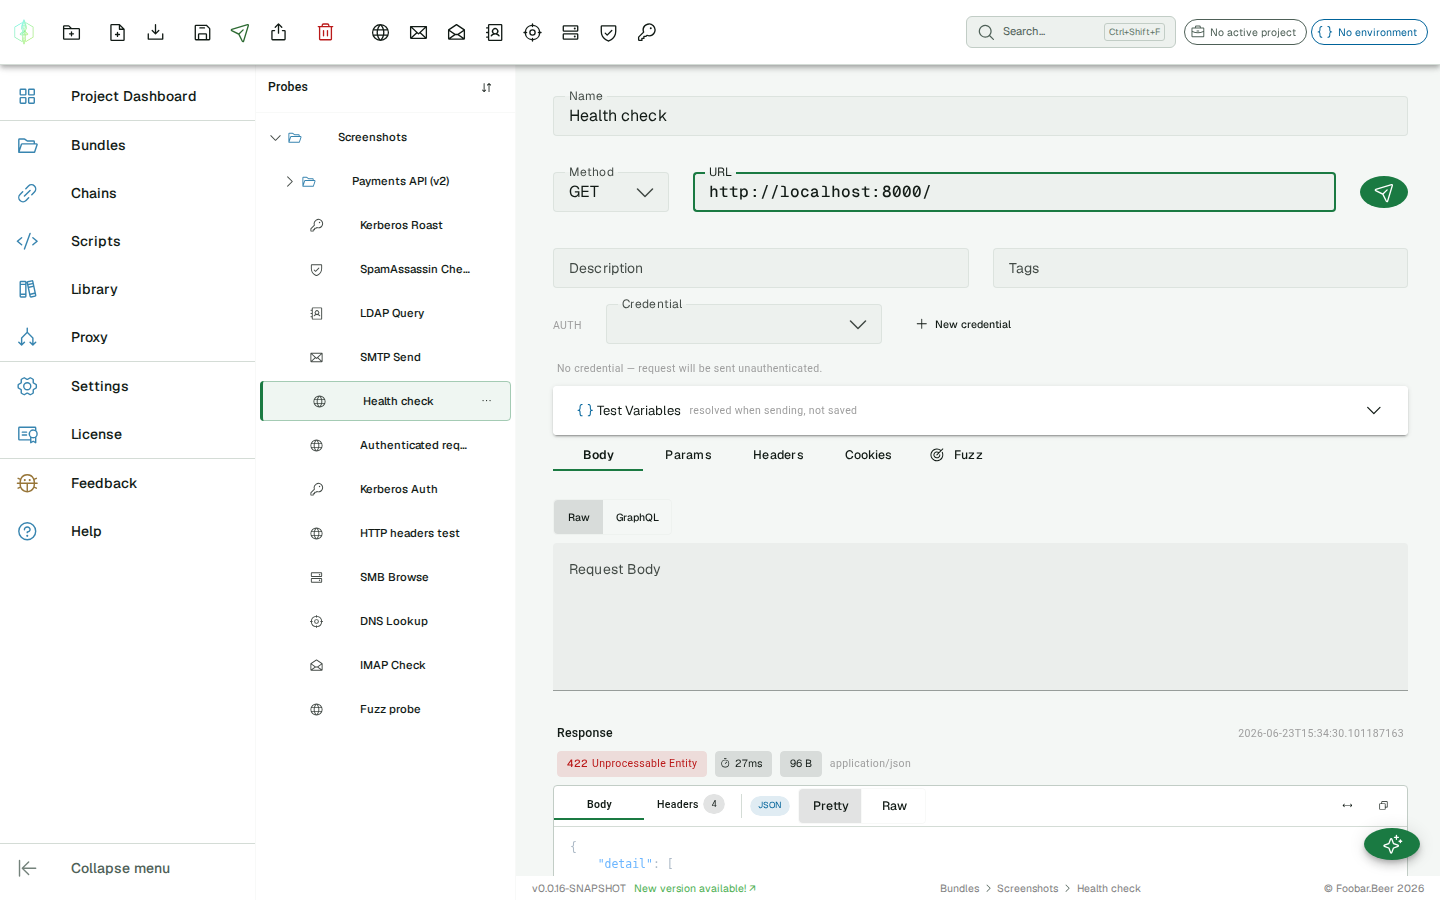
Section titled “Response”After sending a probe, the response panel appears below the request editor.

Status bar
Section titled “Status bar”The top of the response panel shows at a glance:
| Element | Description |
|---|---|
| Status chip | HTTP status code — green (2xx), yellow (3xx), red (4xx/5xx) with the status text (e.g. 200 OK) |
| Timing | Round-trip time in milliseconds, measured from the moment Send is clicked |
| Size | Body size in bytes or KB |
| Content-Type | The Content-Type header value from the response |
Body tab
Section titled “Body tab”
The Body tab has a toolbar with:
- Format badge — detected automatically (JSON, XML, HTML, PLAIN)
- Pretty / Raw / Preview toggle — Pretty formats and syntax-highlights the body; Raw shows the unformatted text; Preview renders HTML in a sandboxed frame (only shown for HTML responses)
- Word wrap button — toggles wrapping of long lines
- Copy button — copies the full body to the clipboard
Pretty mode formats JSON, XML, and HTML with proper indentation. The body area scrolls independently and never overflows the panel.
Headers tab
Section titled “Headers tab”
The Headers tab shows all response headers as a searchable key/value table. Use the filter field to find a specific header by name or value.
Assertions
Section titled “Assertions”Set an expected status code on the probe. If the actual response code differs, the history entry is marked as failed and highlighted with a warning indicator.
Authentication
Section titled “Authentication”The Auth row below the URL is a single Credential picker. Every authentication method is a credential — a reusable, named profile whose secrets are stored separately from the probe (the probe only references a credential by id; passwords, tokens and hashes never live on the probe or in its history). Pick an existing credential or click New credential to create one.
Schemes
Section titled “Schemes”| Scheme | Notes |
|---|---|
| Basic | Username + password, sent as Authorization: Basic |
| Bearer | Static bearer token |
| API Key | Named key sent as a header, query parameter, or cookie |
| Digest | RFC 7616 challenge-response |
| OAuth2 | Client Credentials, Password, and Authorization Code grants (token fetched + cached server-side) |
| NTLM | Windows challenge-response with username + password |
| Pass-the-Hash (PTH) | NTLM using a 32-character hex NT hash, no cleartext password |
| SPNEGO / Kerberos | Authorization: Negotiate ticket obtained from a KDC for HTTP/<host> |
| AWS SigV4 | AWS request signing |
| Scripted | A Groovy script computes the headers at send time |
Scope: global vs project
Section titled “Scope: global vs project”When creating a credential you choose its scope:
- This project — offered only inside the project you’re working in. New credentials default to this scope when a project is active.
- Global — offered everywhere.
The credential picker shows the active project’s credentials plus all global ones.
Project default + resolution order
Section titled “Project default + resolution order”A project can nominate a default credential (Project Dashboard → Default credential). At send time the effective credential is resolved most-specific first:
chain step override → probe credential → project defaultSo a probe with no credential of its own falls back to the project default; a chain step can override both. This applies to standalone sends, chains, and scripts.
How NTLM/PTH work
Section titled “How NTLM/PTH work”For NTLM and PTH, VirtuProbe performs the full 3-message handshake on a single kept-alive socket: Negotiate → server Challenge → Authenticate (with the real request). The response you see is the final authenticated request.
Fuzzing
Section titled “Fuzzing”The Fuzz tab turns any HTTP probe into a lightweight payload injector.
Marker syntax
Section titled “Marker syntax”Place §payload§ anywhere in the probe configuration — URL, body, a header value, a query parameter, a cookie value:
URL: https://example.com/user/§payload§Body: {"username": "§payload§", "password": "test"}Header: X-Custom: §payload§Multiple occurrences of §payload§ in the same probe are all substituted with the same payload per run.
Running a fuzz
Section titled “Running a fuzz”- Open the Fuzz tab on any HTTP probe
- Enter payloads in the textarea — one per line
- Click Run Fuzz
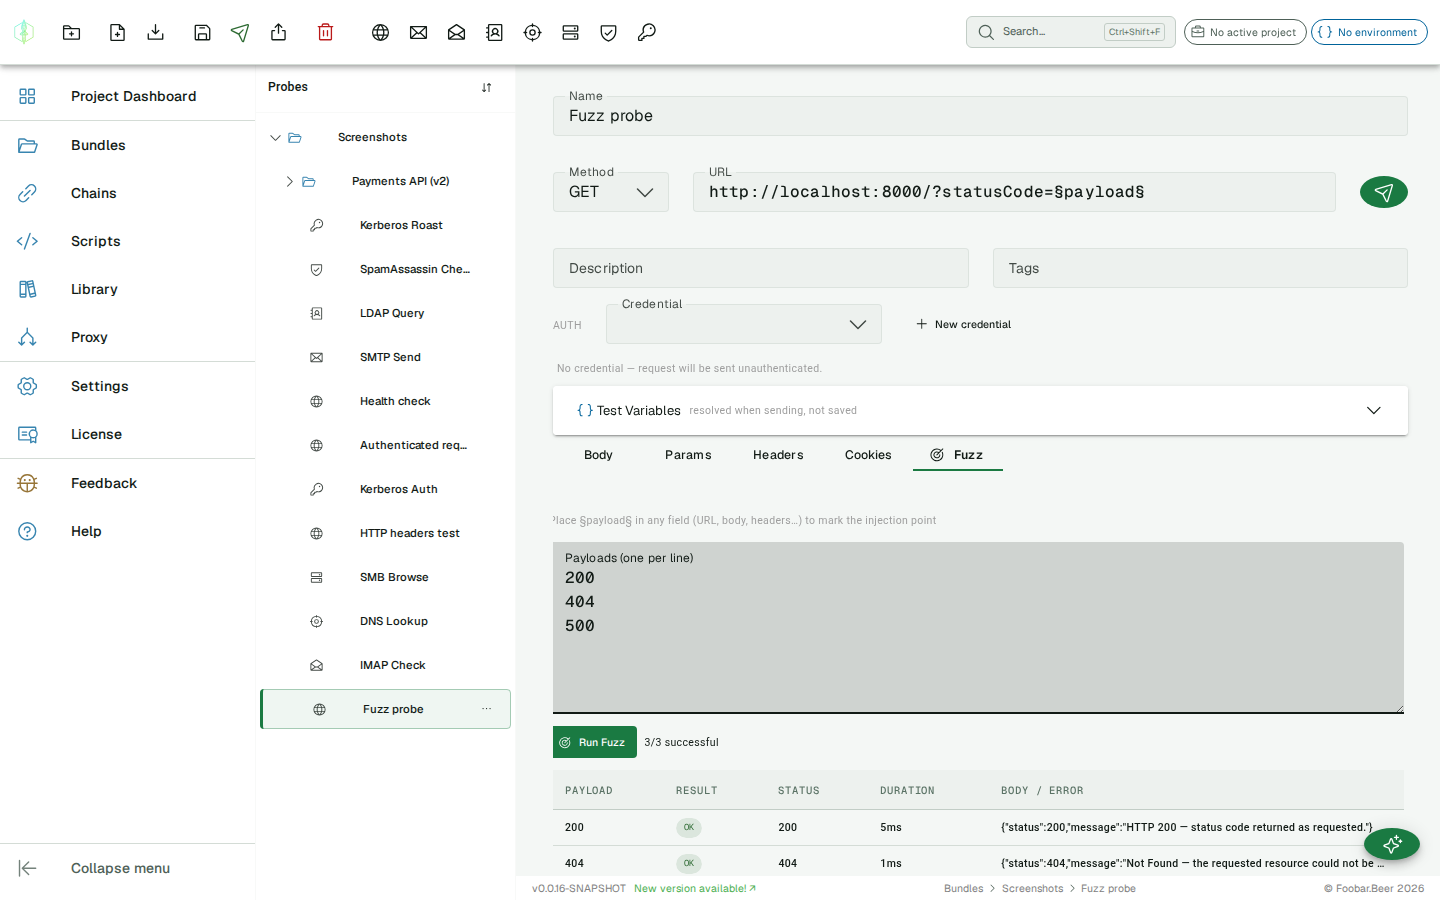
VirtuProbe sends the probe once per payload and streams results into a table:
| Column | Description |
|---|---|
| Payload | The value that was substituted |
| Result | OK (green) / FAIL (red) |
| Status | HTTP status code |
| Duration | Round-trip time in milliseconds |
| Body / Error | First 500 characters of the response body, or the error message |
Payload ideas
Section titled “Payload ideas”- SQL injection strings
- Path traversal sequences (
../,..%2F) - Common usernames or passwords for auth testing
- Large inputs for boundary checking
- Format strings (
%s,%n,%x)
- Fuzz results are not saved to probe history — they are transient for the session
- The fuzz execution runs on the API server, so the same network path and proxy settings apply
History
Section titled “History”
Each send is recorded. The history panel below the response panel shows status codes and timestamps for quick scanning. Click any entry to load that response into the response panel.
Response diff
Section titled “Response diff”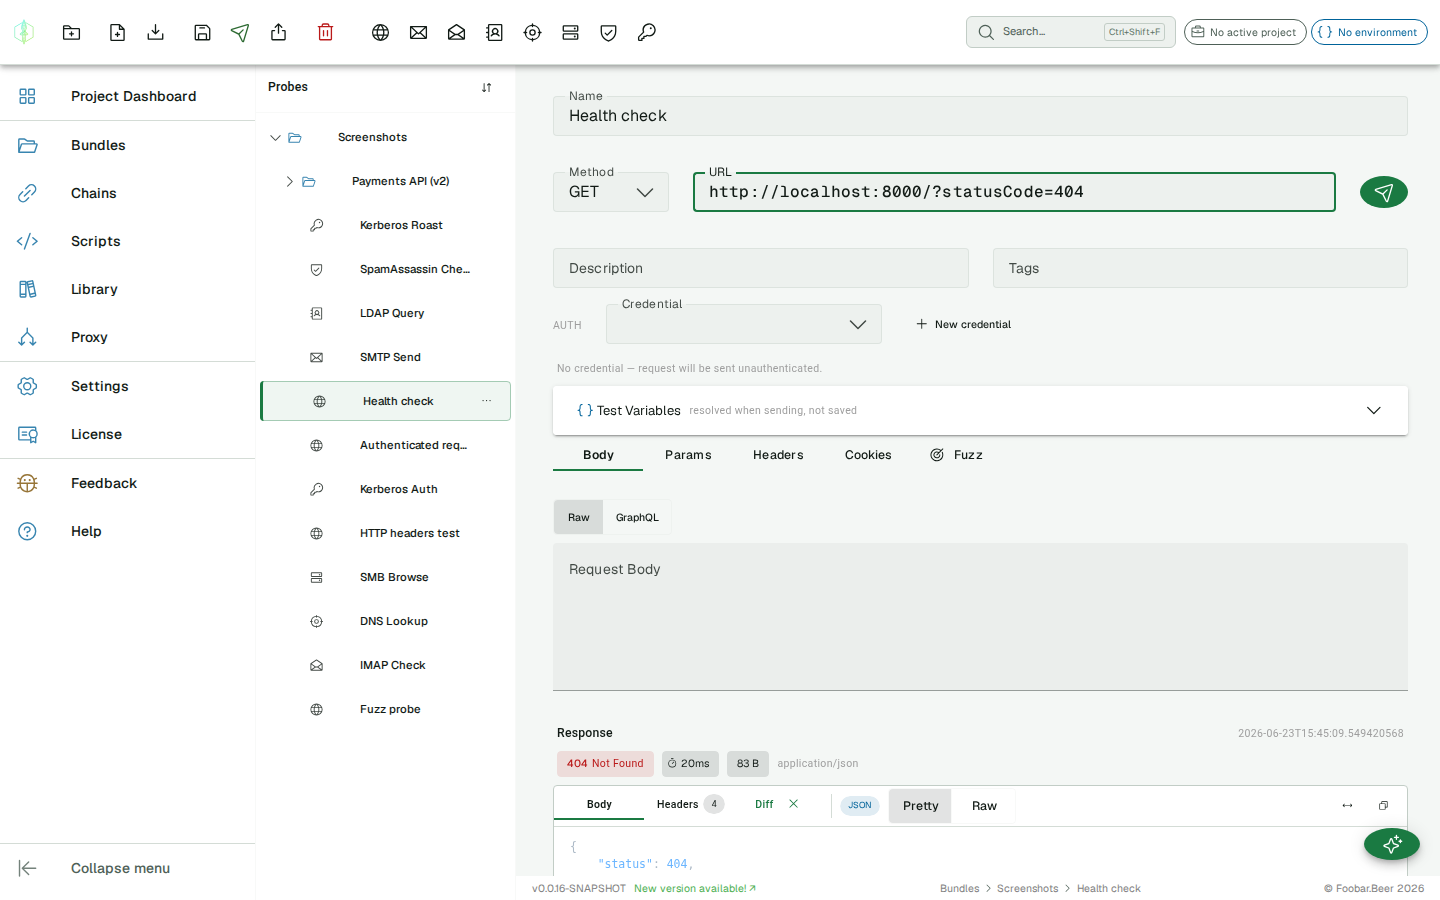
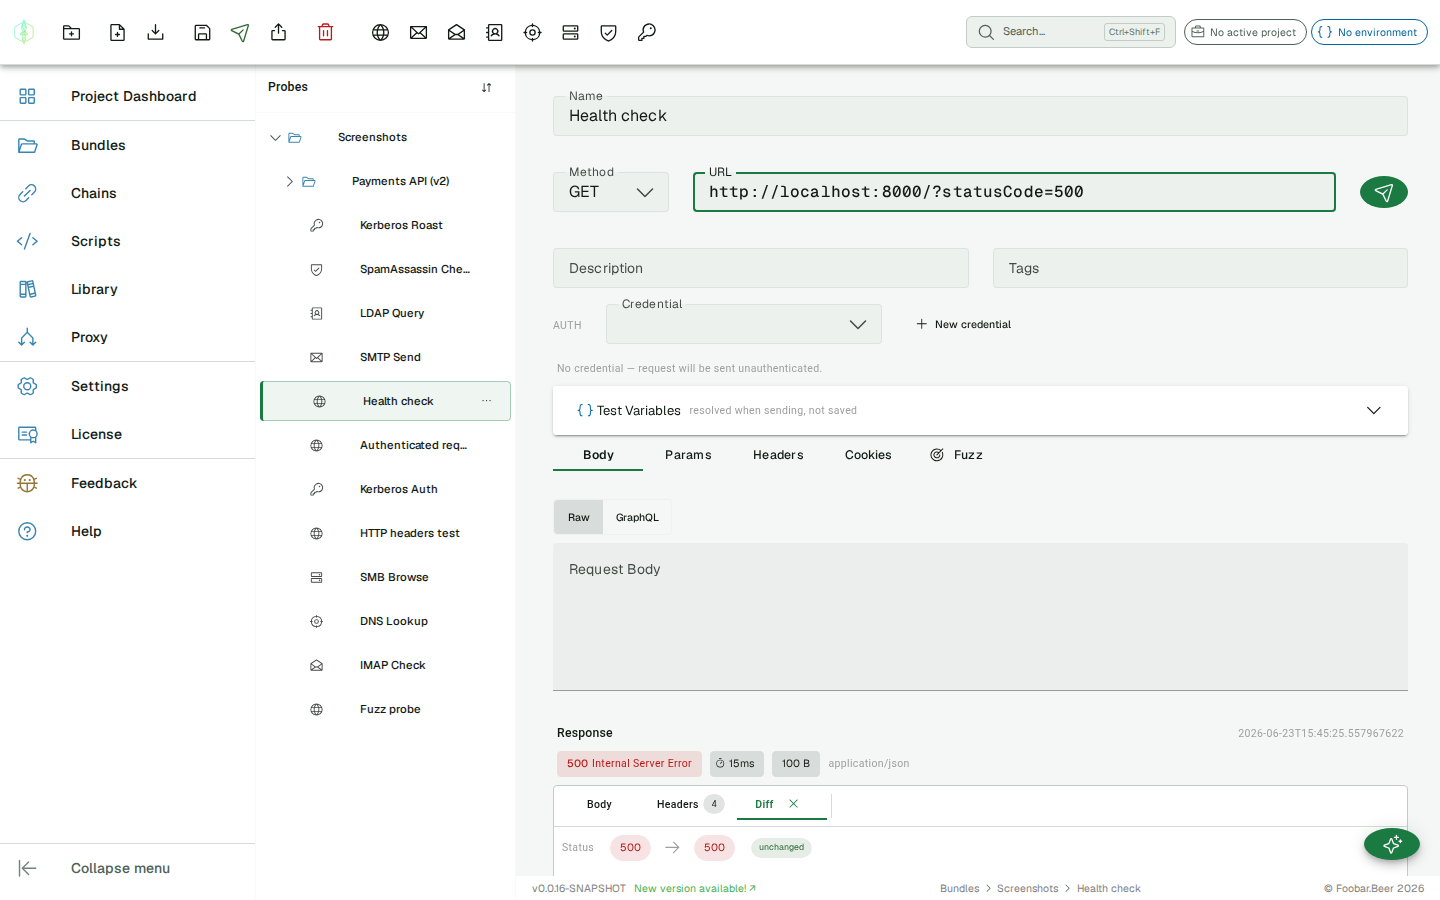
When a response is loaded and history contains at least one other entry, a Compare button appears on each history row. Clicking it opens a Diff tab in the response card showing a comparison between the current response and the selected history entry:
Status comparison
Section titled “Status comparison”The two status codes are shown side by side. If they match, an unchanged chip appears.
Changed headers
Section titled “Changed headers”Only headers that differ between the two responses are shown — with the old value on the left and the new value on the right. If all headers are identical, the section shows No header changes.
Body diff
Section titled “Body diff”A line-level diff using the LCS algorithm. Removed lines are shown in red, added lines in green, unchanged lines in grey. The diff is computed client-side and capped at 500 lines to keep performance predictable.
Click the × on the Diff tab to dismiss the comparison and return to the normal Body/Headers view.