Chains overview
A chain is an ordered sequence of steps that execute one after another. Steps are based on existing probes; the output of one step can be extracted into a variable and injected into subsequent steps via {{variable}} placeholders.
This lets you build end-to-end integration test workflows that span multiple protocols — for example:
- POST to a REST API to create a user
- Wait for the confirmation email and fetch it via IMAP
- Extract the token from the email body
- Use the token in an LDAP BIND to verify directory access

Creating a chain
Section titled “Creating a chain”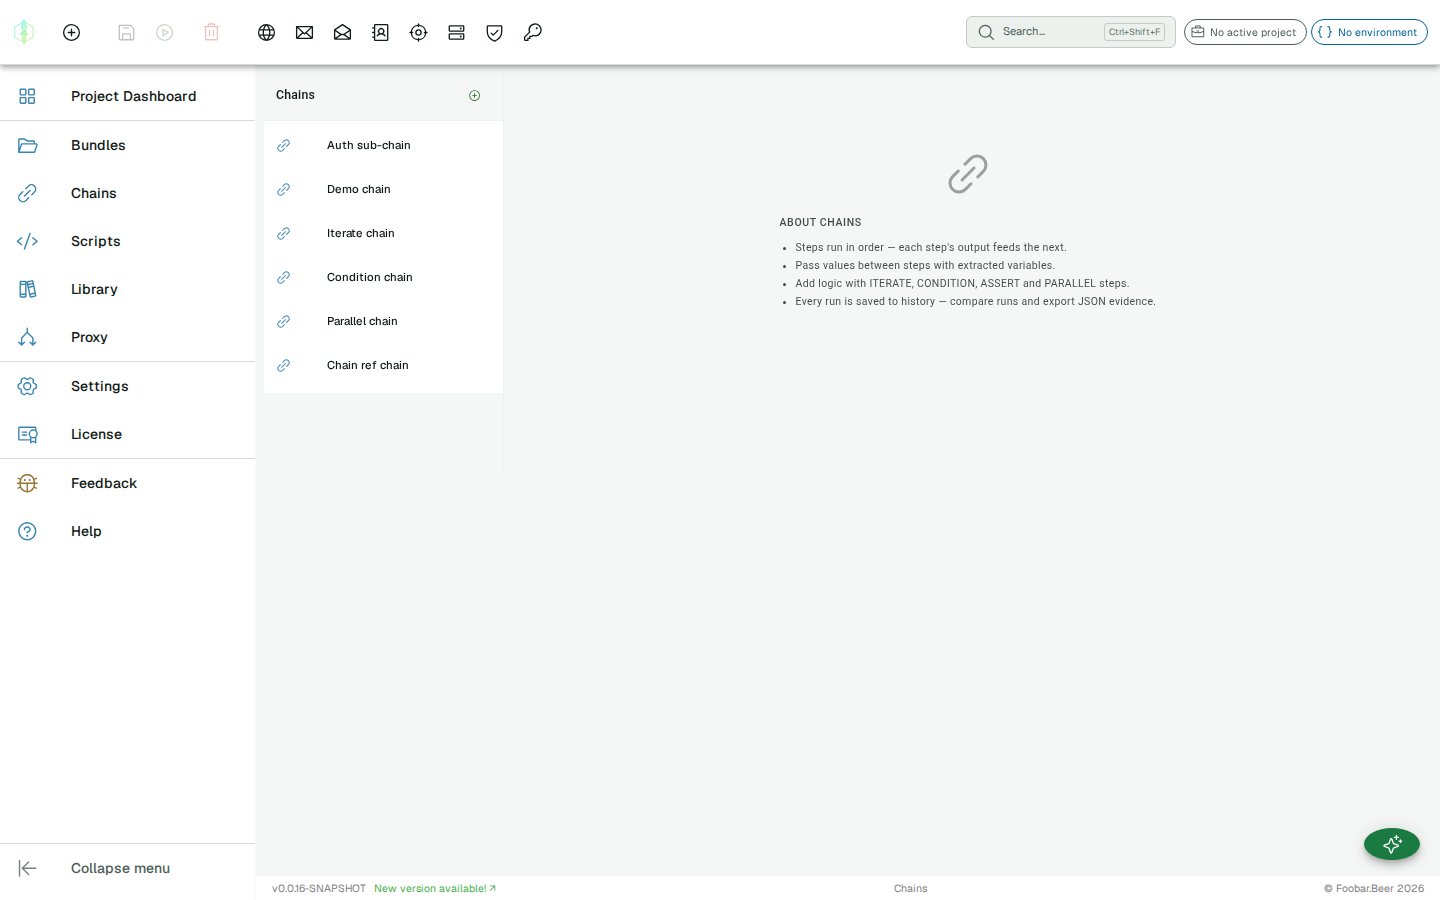
The Chains view has a permanent sidebar on the left listing all chains for the active project. Click any chain to open it in the editor on the right. The sidebar updates instantly when you switch projects.
Click the + button at the top of the sidebar to create a new chain — the chain name is required before it can be saved. The chain is automatically assigned to the active project. A chain starts empty; add steps using the toolbar buttons in the editor.
You can also create chains from the project dashboard: open the project picker in the app bar, click Project Dashboard, and click New Chain in the Chains section.
Step types
Section titled “Step types”| Type | Description |
|---|---|
| HTTP | Send an HTTP request |
| SMTP | Send an SMTP command sequence |
| IMAP | Execute IMAP commands |
| LDAP | Execute LDAP operations |
| DNS | Send DNS queries |
| SpamAssassin | Submit a message for spam scoring |
| ITERATE | Loop over a list and execute child steps per item |
| CONDITION | Branch on a Groovy boolean expression — if true, execute the then branch; otherwise the else branch |
| PARALLEL | Execute multiple child steps simultaneously; variables are merged when all complete |
| CHAIN_REF | Call another chain as a sub-routine, with explicit input and output variable mapping |
| Print a variable value to the execution log | |
| ASSERT | Assert that a variable matches an expected value — fails the chain if the condition is not met |
Variable flow
Section titled “Variable flow”Variables are shared across the entire chain execution context. An extractor on step 2 can produce a variable that step 5 reads from.
CONDITION and ITERATE steps pass the shared variable context into their child steps, so extractors inside a branch can produce variables that are visible after the step completes.
PARALLEL branches each receive a snapshot of the variable context at the time the step starts. After all branches finish, their extracted variables are merged back into the shared context (last-writer-wins if two branches extract the same name).
CHAIN_REF steps have explicit variable mapping — variables do not flow automatically between a parent chain and a sub-chain. See CHAIN_REF for details.
See Extractors for a full reference of what can be extracted from each protocol.
Execution
Section titled “Execution”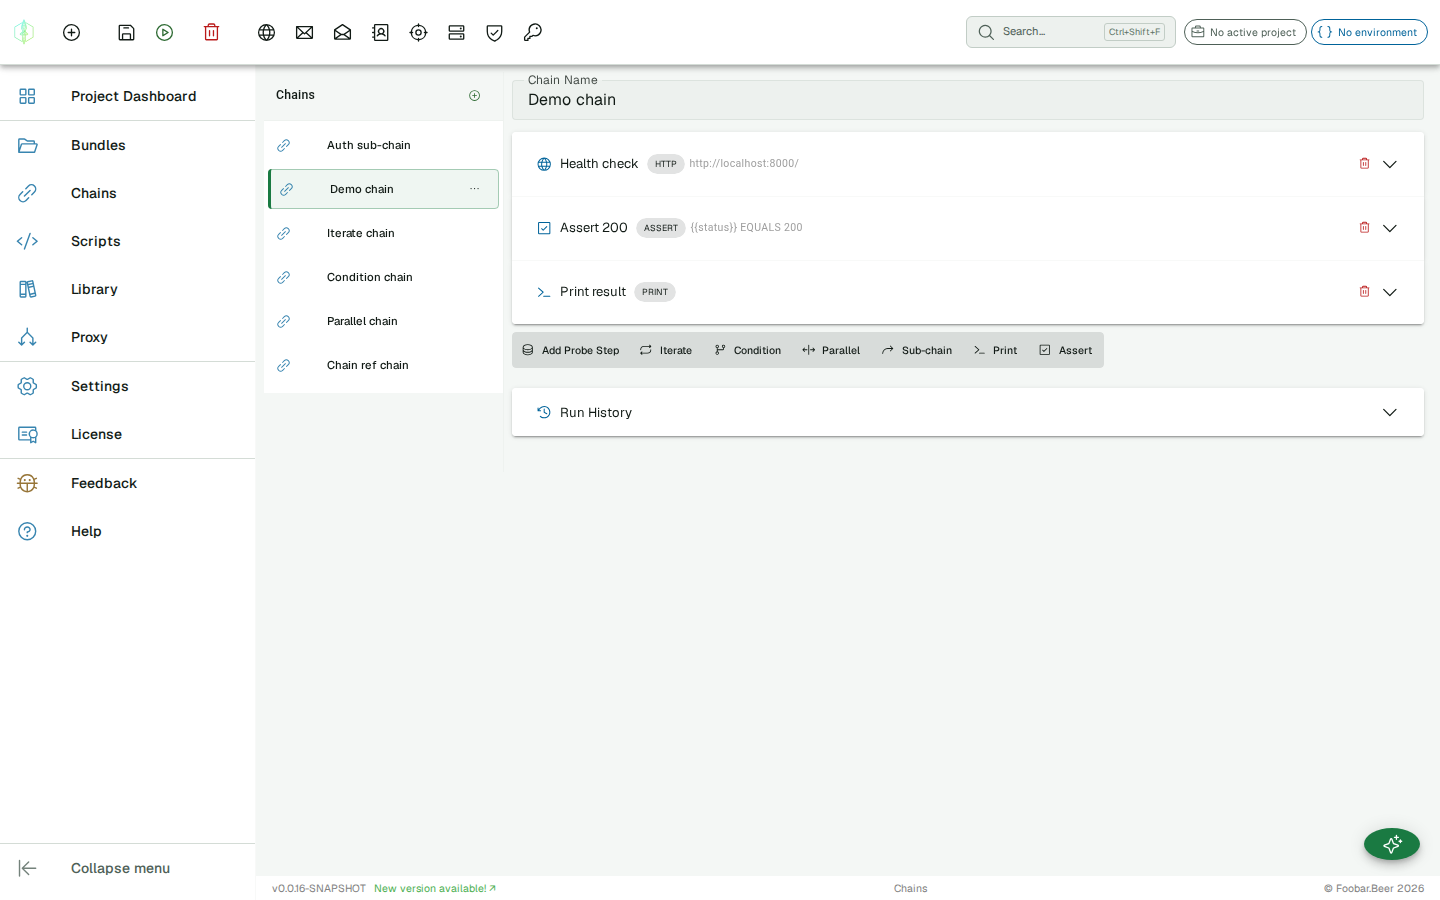
Click Run to execute the chain. Results stream into the execution log as steps complete — each step shows its status (success / failure) and the key-value variables it produced.
Run history
Section titled “Run history”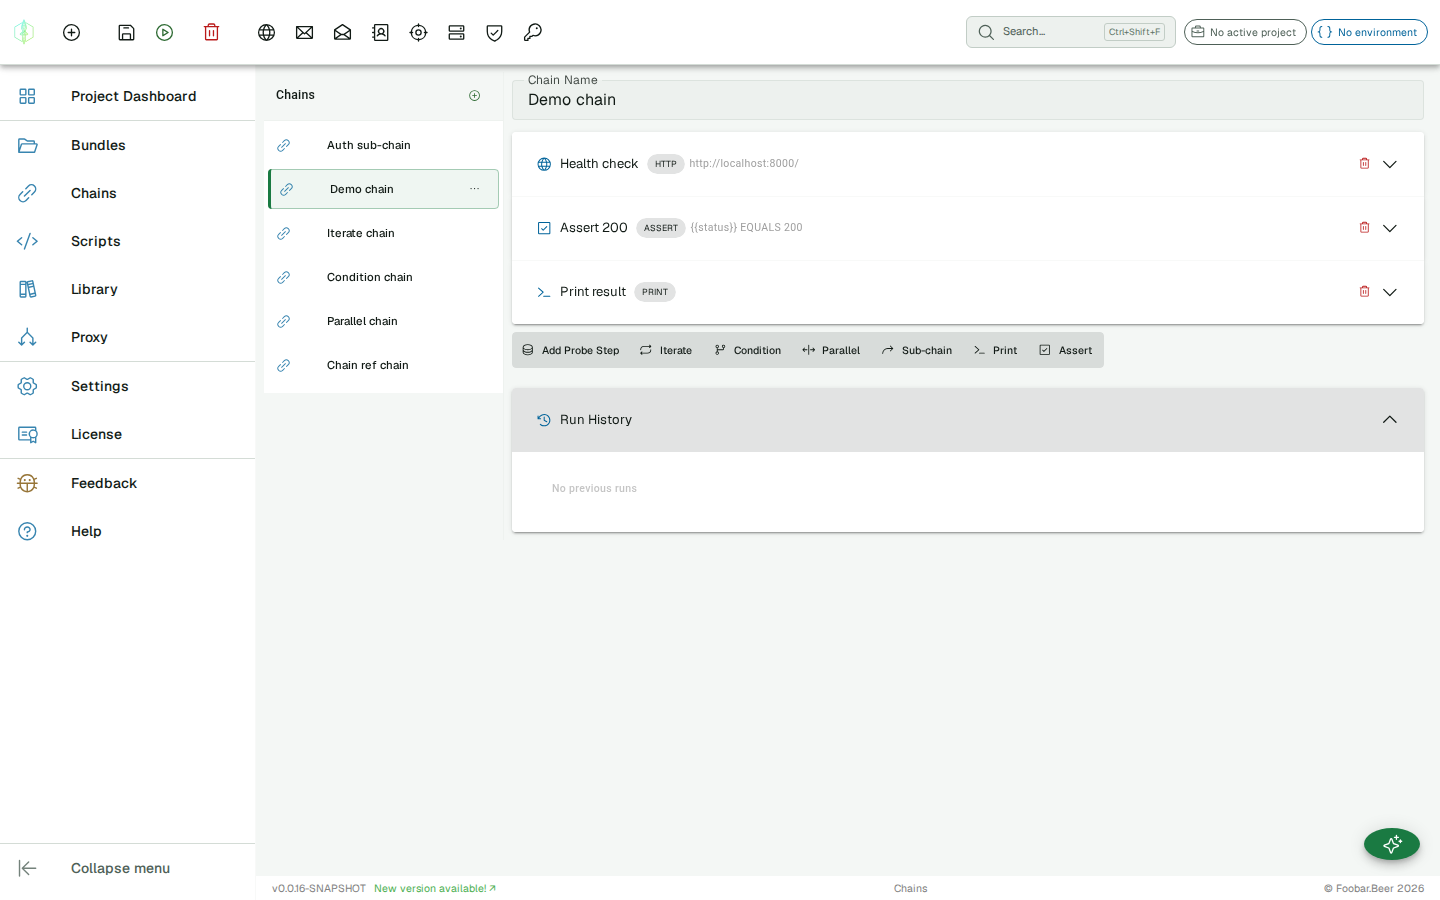
Every chain run is automatically saved. The Run History panel below the execution log shows up to 20 past runs per chain, ordered newest first. Each entry shows:
- A green check or red warning icon (overall success/failure)
- The date and time the run completed
- Assertion summary (e.g. 3/4 assertions passed), when assertions were used
Click any history entry to restore it — the execution log updates to show that run’s results and final variables, exactly as they were recorded. The active entry is highlighted.
Comparing runs
Section titled “Comparing runs”
Click Compare on any history entry while a run is already displayed to enter diff mode. The results panel switches to a side-by-side comparison table:
| Column | Description |
|---|---|
| Step | Step name (or type if unnamed) |
| A | Result from the current run — success/failure icon and output value |
| B | Result from the selected history run |
Rows where the outcome differs (different success state, output, or error) are highlighted. Click Exit Compare to return to the normal results view.
Exporting results
Section titled “Exporting results”Two export formats are available in the results panel toolbar when a run is displayed:
JSON Evidence
Section titled “JSON Evidence”Click JSON Evidence to download a .json file containing the full execution result — all step results, extracted variables, and assertion outcomes, plus the chain metadata and the timestamp the run was executed. This format is designed for pentest reports, evidence archives, and audit trails.
{ "chain": { "id": "...", "name": "OAuth Login Flow" }, "executedAt": "2026-06-07T09:14:22.000Z", "result": { "success": true, "stepResults": [ ... ], "finalVariables": { "token": "eyJ..." }, "assertionSummary": { "total": 3, "passed": 3, "failed": 0 } }}JUnit XML
Section titled “JUnit XML”Click JUnit XML to re-run the chain and download a standard JUnit XML report. This format is understood by CI platforms (Jenkins, GitHub Actions, GitLab CI, TeamCity) and test reporting tools. Each chain step maps to a <testcase>; failed steps produce <failure> elements with the error message.